School exclusion isn’t a new concept – schools have been using it to try and tackle disruptive, unacceptable behaviour for decades and there is a lot of controversy surrounding whether it’s actually an effective way to deal with these behaviours.
However, what we don’t often talk about is whether exclusion rates are increasing as time goes on, or actually decreasing, and which areas in the UK are improving the most.
With that in mind, we’ve taken a look at the most recent exclusion data and compared it against figures from a decade ago to see which local authorities have seen the biggest improvements in their exclusion numbers.
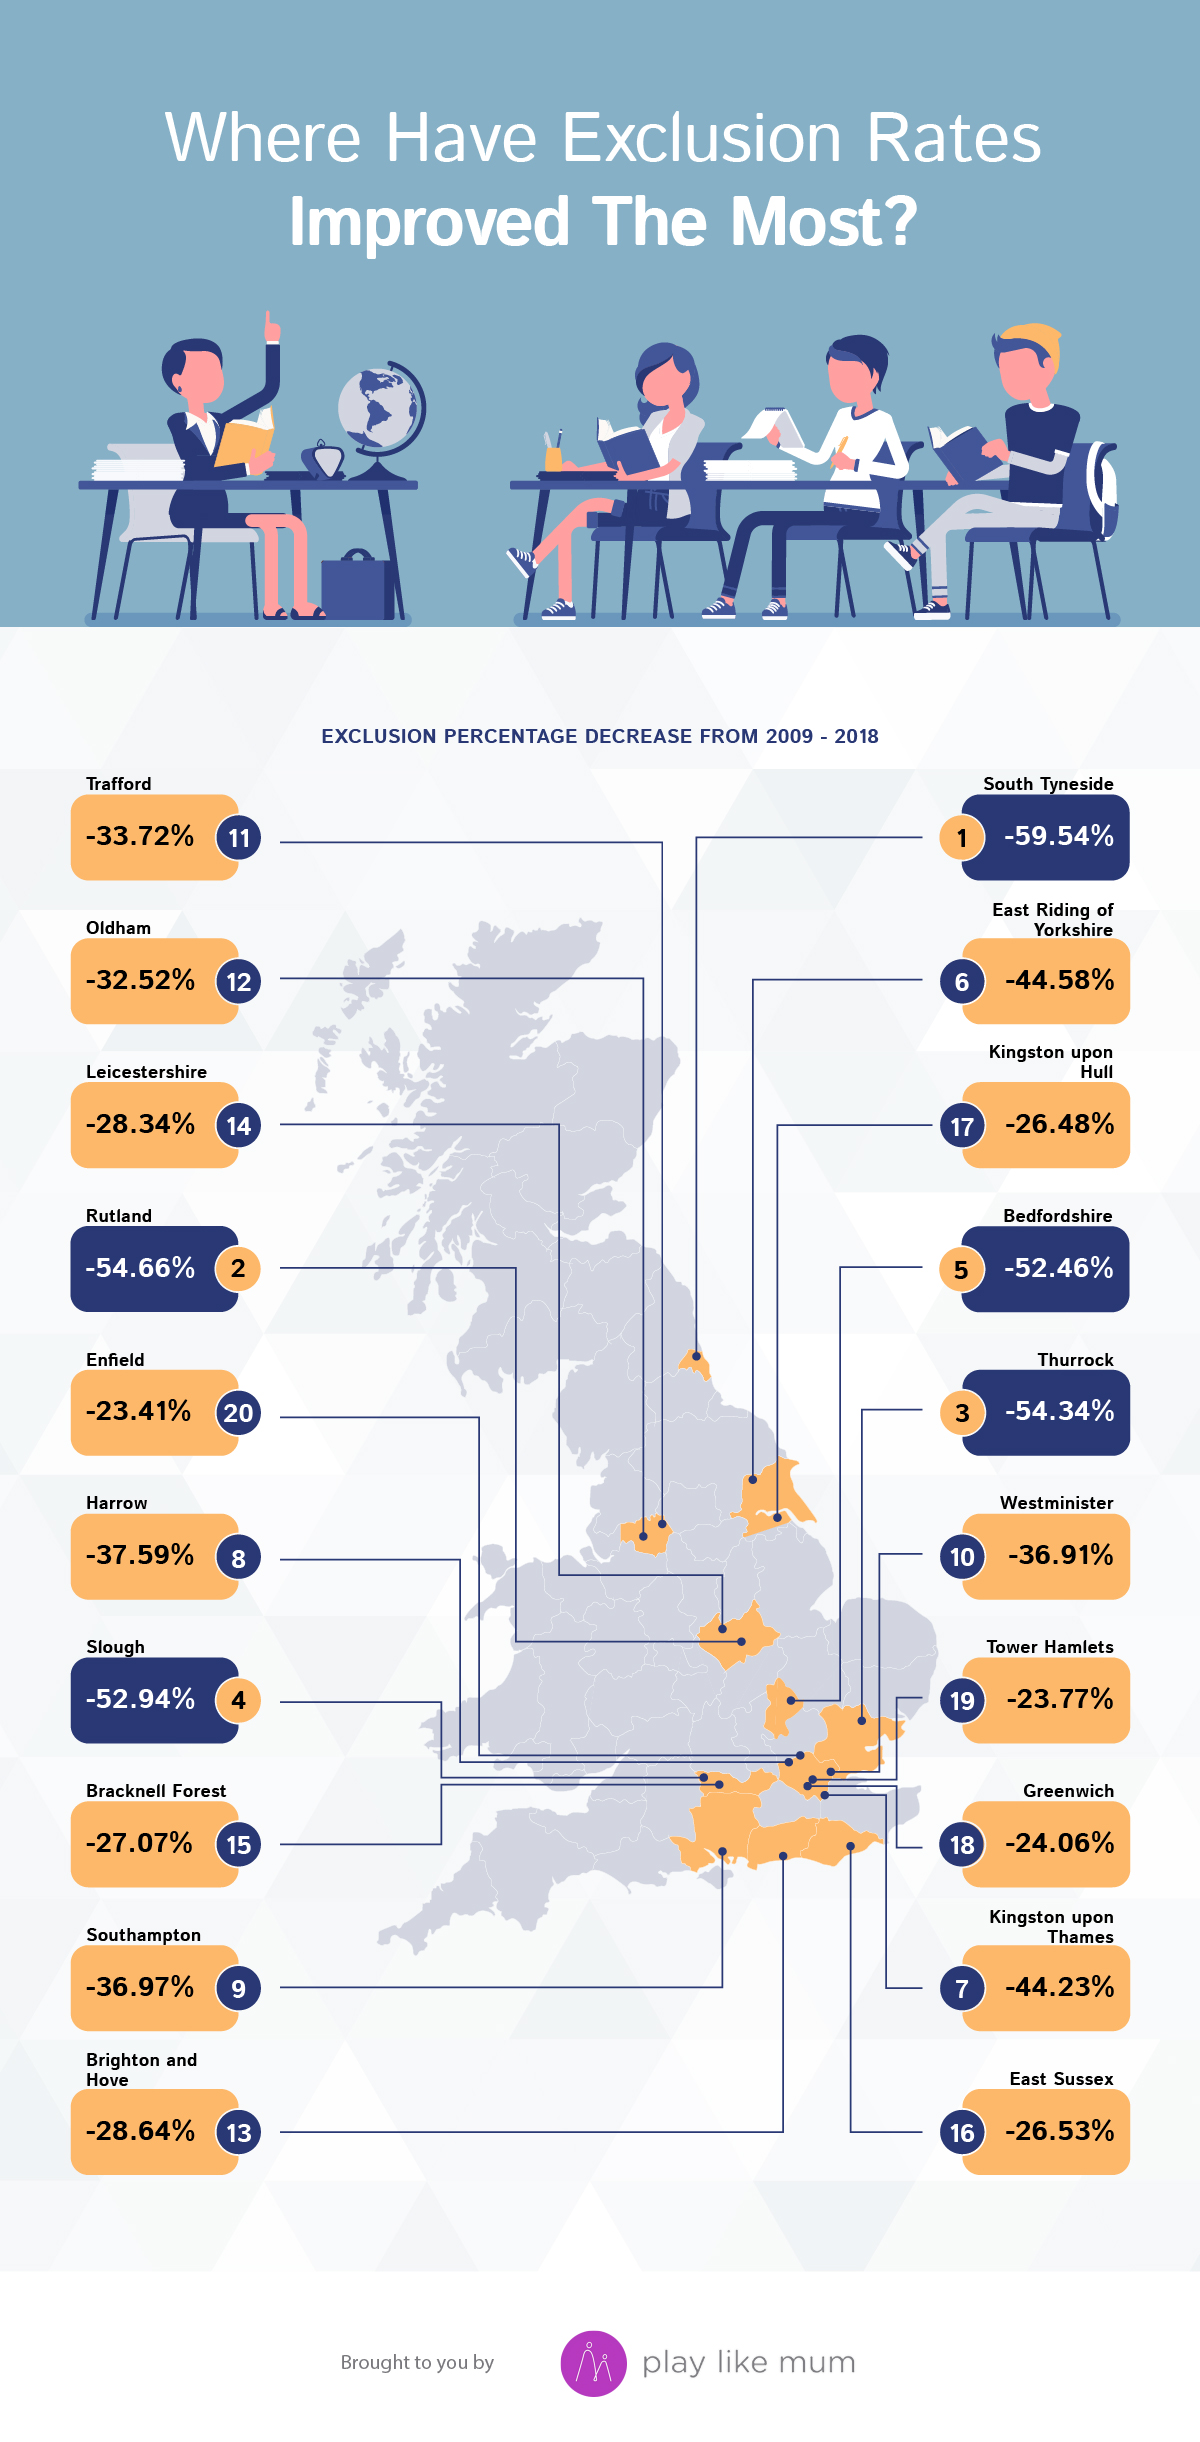
Where Have Exclusion Rates Improved the Most in the UK in 10 years?

| Total Exclusions ’09 | Total Exclusions ’18 | Difference | % Decrease | ||
| 1 | South Tyneside | 1,493 | 604 | -889 | -59.54% |
| 2 | Rutland | 161 | 73 | -88 | -54.66% |
| 3 | Thurrock | 1,417 | 647 | -770 | -54.34% |
| 4 | Slough | 2,091 | 984 | -1,107 | -52.94% |
| 5 | Bedfordshire | 2,316 | 1,101 | -1,215 | -52.46% |
| 6 | East Riding of Yorkshire | 3,721 | 2,062 | -1,659 | -44.58% |
| 7 | Kingston upon Thames | 1,153 | 643 | -510 | -44.23% |
| 8 | Harrow | 1,615 | 1,008 | -607 | -37.59% |
| 9 | Southampton | 7,628 | 4,808 | -2,820 | -36.97% |
| 10 | Westminster | 894 | 564 | -330 | -36.91% |
| 11 | Trafford | 1,904 | 1,262 | -642 | -33.72% |
| 12 | Oldham | 2,263 | 1,527 | -736 | -32.52% |
| 13 | Brighton and Hove | 3,439 | 2,454 | -985 | -28.64% |
| 14 | Leicestershire | 4,545 | 3,257 | -1,288 | -28.34% |
| 15 | Bracknell Forest | 2,268 | 1,654 | -614 | -27.07% |
| 16 | East Sussex | 9,160 | 6,730 | -2,430 | -26.53% |
| 17 | Kingston Upon Hull | 1,688 | 1,241 | -447 | -26.48% |
| 18 | Greenwich | 1,463 | 1,111 | -352 | -24.06% |
| 19 | Tower Hamlets | 1,119 | 853 | -266 | -23.77% |
| 20 | Enfield | 2,776 | 2,126 | -650 | -23.41% |
The 10 Most Common Reasons For Exclusion
We also wanted to know why students were being expelled – is there an overall common theme as to why young people are being taken out of school for behavioural reasons?

Methodology
Using Department of Education statistics surrounding exclusions from schools in every local authority in the UK during 2008/2009 and 2017/2018, we analysed the number of permanent and fixed-period exclusion numbers and combined them to give an overall total for exclusions during those years in each authority, from which we were able to rank each area on the number of exclusions.
We also looked at the reason for exclusion, combining the fixed-period and permanent exclusion data to give an overall total for each year for each reason. We then ranked the reasons from highest to lowest nationally to give the most common reason for exclusion in the UK in both 2008/2009 and 2017/2018.
We omitted data from the Isle of Scilly, Central Bedfordshire and the City of London due to incomplete data over both time periods.
The totals for Cheshire in 2017-2018 were created by combining the ‘Cheshire West and Chester’ data with ‘East Cheshire’ to give a total which could be compared to 2008-2009’s ‘Cheshire’ data.
Schools with expulsion rates of between one and five don’t publish specific numbers of exclusions to avoid potentially identifying the pupils concerned. In these instances, we have assumed the number of exclusions to be five for ranking purposes.
Sources
https://www.gov.uk/government/collections/statistics-exclusions

